
Before starting the planning and construction for a project, several maps that depict the site’s characteristics are required to ensure efficient planning. One of these is a contour lines map, which provides valuable information regarding the natural features of a site. Continue reading to discover what contours are, how contour lines are mapped, why a contour map is important and how to read it.
What are Contours?
A contour is a representation of the different elevations, levels or heights in a property or land. Contour lines in topographic maps depict imaginary lines which join together different points on the ground that have the same elevation. Typically, the elevation is measured as a height from the mean sea level or from a specific reference selected near or on the site. A contour map is one of the types of maps used in land survey and depicts how steep or flat a land area is, thus guiding design and construction decisions.
How is Contour Mapping Done?
Different types of site surveys are conducted to create a contour map. Commonly, site contour maps are generated by the following processes:
- Manual Contour Map Drawing
Land surveyors manually inspect the site with tools like total stations and theodolites. Measurements are taken at regular intervals on the ground, and the data obtained is then manually plotted on grid papers. Spot elevations recorded at the regular intervals are marked and then each point with the same elevation is joined by a line (which is the contour line).
- Digital Contour Mapping
Data from equipment such as drones, high-quality cameras, topographic scanners and underground radars is correlated with information gained from GPS satellites and GIS (Geographic Information System). This data is then loaded onto softwares like BIM (Building Information Modelling) and Petra, which can generate DEMs (Digital Elevation Models) and virtual topographic maps.
- Hybrid Mapping
This method is most commonly used. Both physical and digital land surveys are done, and the data is used to manually or digitally (using 2D drafting software like AutoCAD) draft contour line maps.
Why is a Contour Map Important for Construction?
Reviewing topographic maps and contour lines is essential for any type of construction. Some of the important uses of contour maps are:
- Land Use Planning: Site contours illustrate how steep or flat a land parcel is. The ideal use for the land can be determined on the basis of this information. For instance, a land may be ideal for terrace farming if it has uniformly sloping surfaces. On the other hand, flat land is typically preferred for high rise buildings.
- Natural Conservation: Topography lines show the location of ridges and valleys, indicating the natural path of water drainage through a site. This information is crucial for site analysis and helps designers avoid construction along these pathways, preventing the disruption of natural water cycles.
- Aids Architectural Design: Important architectural design decisions—such as building placement and orientation, placement of openings to optimise views and circulation pathways through the property—are majorly based on data regarding the contours of land.
- Guides Structural Design: Land contour maps depict the presence of rocks and the type of soil present in a property. These are major guiding factors for what types of foundations are required to sufficiently support any construction in the land.
- Project Budgeting: The amount of earth-cutting and filling needed for a building project significantly impacts the total project cost. This data is obtained through a contour index map, which thus helps in project budgeting.
How to Read a Contour Lines Map?
It is important to understand the components of a contour map or topographic map in order to be able to interpret it correctly. The following are some key points to remember:
Features of Contour Lines
- Each contour line represents a single elevational value. Two contour lines can never intersect each other because a single point on land cannot have two different elevations.
- Contour lines form closed shapes, but these are not necessarily within a map’s boundaries.
- Standard units like feet (ft), meters (m) or millimeters (mm) are used to represent the height of a region above mean sea level or sometimes above a specific reference point.
- Hills are shown by roughly circular closed lines with rising values toward the center.
- Depressions are shown by roughly circular closed lines with decreasing values toward the center.
Types of Contour Lines
- Index Contours: These are the lines shown with the highest thickness in maps and represent rounded-off elevation values like 100m, 200m, 300m, etc.
- Intermediate Contours: Depict heights that come in-between the index values. For example: 120m, 150m, etc. are intermediate contours shown in a lighter format when the index values are 100m and 200m.
- Supplementary Contours: These are dotted lines representing random elevational values in important zones. They are used when there is a sudden change in the terrain.
Apart from these types, some of the important terms to understand while reading a contour line topographic map are:
- Contour Spacing: This refers to the distance between each successive contour line, which depicts the steepness or gentleness of slopes. For instance, closely spaced contour lines indicate steep slopes, widely spaced ones represent a gentle slope and uniformly spaced ones mean a uniform slope.
- Contour Intervals: The difference in values between successive contour lines is called a contour interval. For example, a map showing contour lines with elevation values of 1m, 2m, 3m, etc. has a contour interval of 1m, while a map with 5m, 10m, 15m contour lines has a contour interval of 5m.
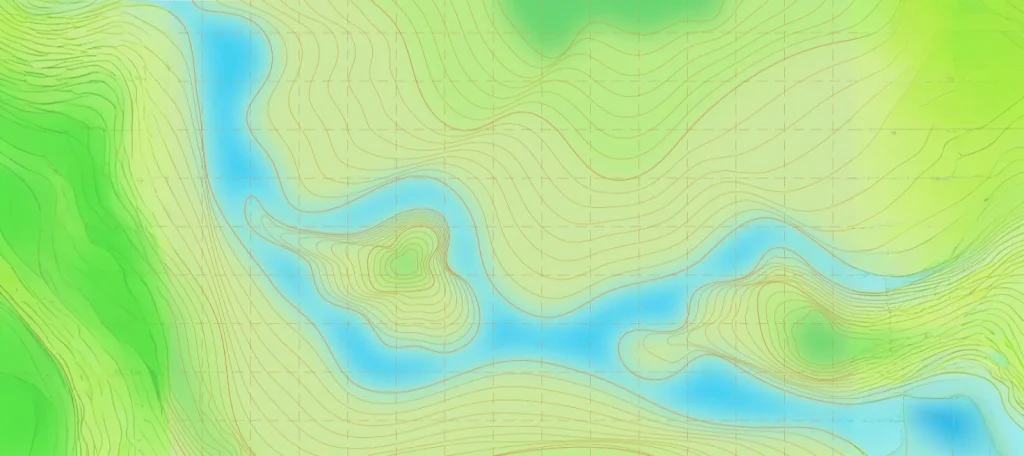
- Annotations and Symbols: In contour lines, V-shapes pointing towards higher elevation lines indicate valleys, while those pointing towards lower elevation lines are ridges. Other common contour map symbols include blue lines for water bodies and green shapes or shading for vegetation.
- Map Scale: The map scale (1:50, 1:100, 1:000, etc.) is determined by the size of the land to be mapped. Using very small scales like 1:1000 for small land areas can mean that the map does not provide very valuable data.
Surveying Contour Geography for Construction
The mapping of contours and topography lines is essential for the success of any building project. Brick & Bolt, one of the top construction companies in India, conducts extensive site surveys for every project. With over 7000 completed projects, the company understands the value and importance of such surveys in every project and employs qualified professionals for reliable contour mapping. Get in touch with Brick & Bolt today to fulfill your residential and commercial design and construction needs based on the results of accurate contour maps!